

Modern businesses generate more operational data than ever before. Sales, customer engagement, marketing performance, financial metrics, operational efficiency, and customer satisfaction all change in real time. The challenge isn’t collecting data—it’s turning that data into decisions.
That’s where 360-degree business dashboards become a competitive advantage.
Rather than forcing executives to navigate multiple reports, spreadsheets, and disconnected software platforms, a 360-degree dashboard centralizes every critical business metric into one intelligent view. Combined with AI-powered insights, these dashboards don’t just display numbers—they explain what changed, why it matters, and what actions leaders should take next.
According to SaaStr, dashboards have become one of the most valuable features in modern SaaS platforms because they help customers continuously measure ROI, increase product adoption, and improve long-term retention.
At HyperTrends, we design intelligent dashboards that combine real-time monitoring, predictive analytics, AI-generated summaries, and intuitive navigation to help organizations make faster, smarter decisions every day.
Quick Answer
A 360-degree business dashboard is a centralized business intelligence platform that combines data from multiple systems into a single real-time view. Instead of manually reviewing reports, executives receive live KPIs, automated alerts, AI-generated insights, and actionable recommendations that improve operational visibility and accelerate decision-making.
Why Modern Businesses Need 360-Degree Dashboards
Every department produces valuable information, but that information often lives inside different software platforms.
Marketing teams monitor campaign performance.
Sales teams track revenue.
Operations monitor efficiency.
Customer Success follows retention.
Finance measures profitability.
Without a centralized dashboard, executives spend more time gathering information than making decisions.
A modern executive dashboard eliminates that problem by bringing every important KPI together into one unified experience.
Key Benefits
- Real-time business visibility
- Faster executive decision-making
- AI-powered business summaries
- Improved operational efficiency
- Reduced reporting time
- Better customer retention
- Increased executive confidence
Real-Time Alerts That Keep Your Business Ahead
Waiting until the end of the week—or even the end of the day—to discover a problem can be costly.
A sudden increase in customer churn.
An unexpected drop in online conversions.
A decline in franchise performance.
An increase in abandoned shopping carts.
A modern dashboard continuously monitors these metrics and immediately alerts decision-makers whenever performance moves outside expected thresholds.
Instead of reacting after problems occur, businesses can respond while opportunities still exist.
The 2-Click Philosophy: Simplicity Without Sacrificing Depth
Executives don’t have time to navigate complicated reporting systems.
That’s why HyperTrends follows a simple design principle:
Every important answer should be accessible within two clicks.
Users begin with a high-level executive overview and can instantly drill into detailed operational data without navigating dozens of reports.
This approach dramatically reduces friction while increasing adoption across the organization.
AI Turns Data Into Business Stories
Data alone doesn’t create business value.
Understanding does.
Instead of forcing users to interpret charts and spreadsheets, AI analyzes business performance and generates natural-language explanations that answer questions like:
- What changed today?
- Why did revenue increase?
- Which locations require attention?
- Which customer segments are growing?
- What should leadership focus on next?
The result feels less like reading analytics software and more like receiving a personalized executive briefing every morning.
Case Study: Performance360
Performance360 operates multiple gym locations, each generating thousands of operational data points every day.
HyperTrends developed a centralized dashboard that consolidates information from every franchise into one executive view.
Leadership can monitor:
- Membership growth
- Customer retention
- Class attendance
- Cancellations
- Coach ratings
- Location performance
- Operational KPIs
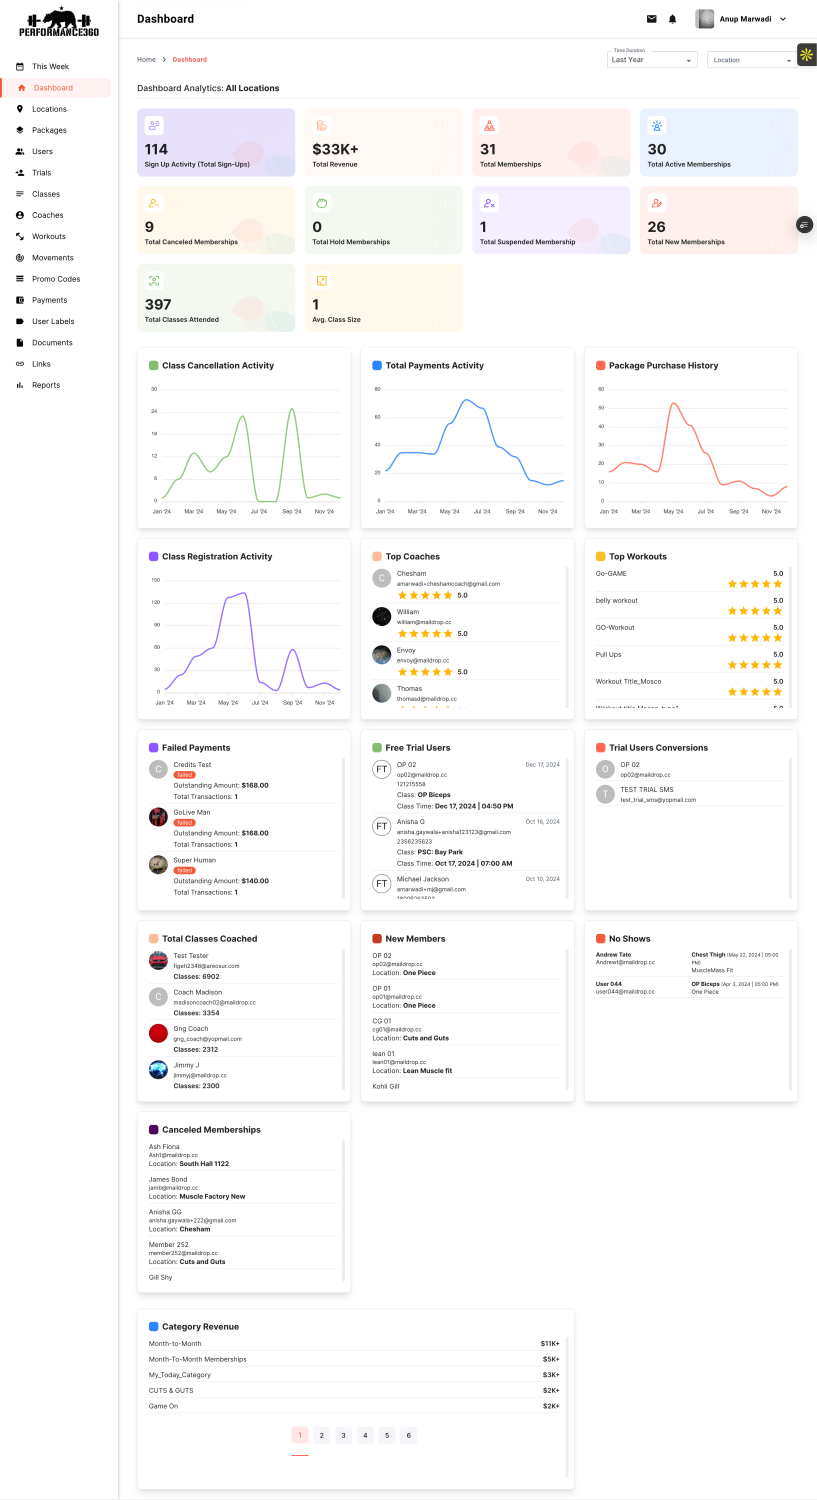
Instead of waiting for manual reports, executives receive an always-updated view of franchise performance, allowing them to identify trends early and improve operational efficiency across every location.
Case Study: TicketBlox
TicketBlox uses HyperTrends dashboards to provide event organizers with real-time visibility into ticket sales and customer behavior.
The dashboard tracks:
- Ticket sales
- Checkout completion rates
- Cart abandonment
- Revenue trends
- Geographic sales distribution
- Customer demographics
- Marketing performance
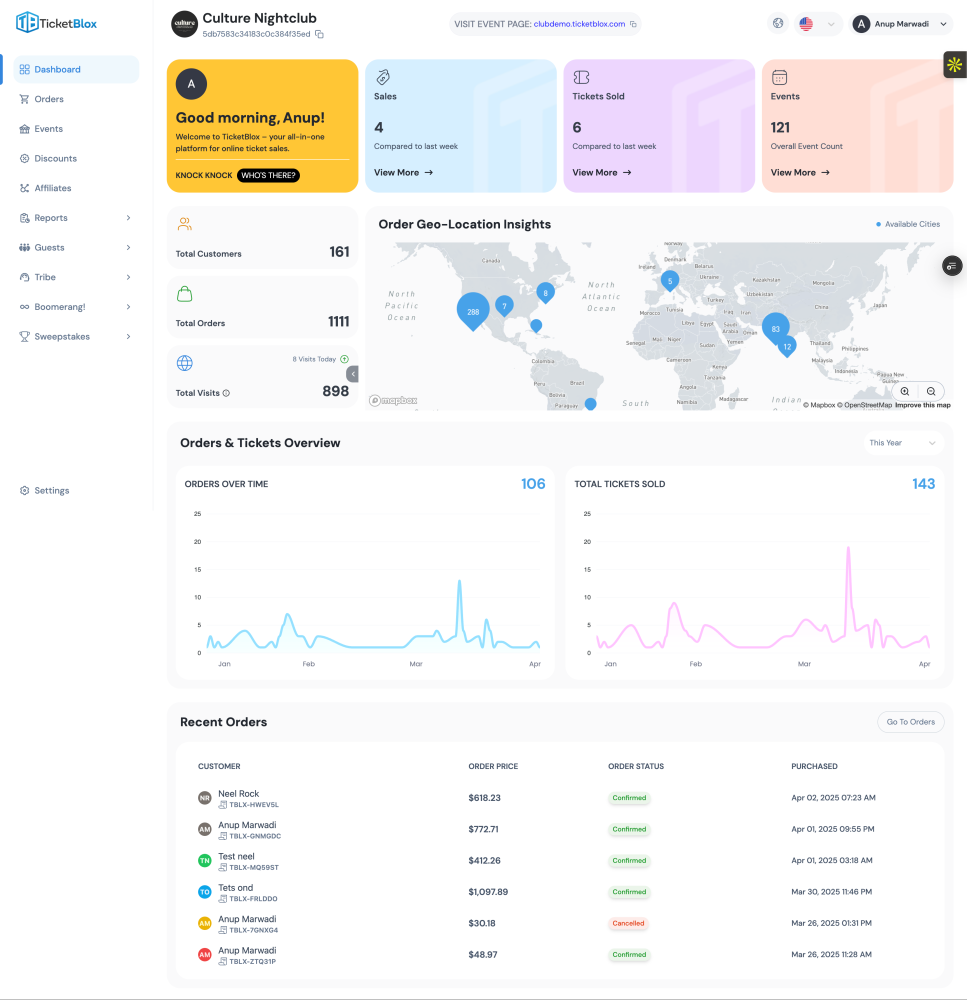
One of the platform’s most valuable capabilities is AI-powered insight generation.
Rather than presenting raw numbers, the system produces easy-to-understand summaries that explain what changed, identify emerging trends, and recommend actions organizers should take to maximize ticket sales.
Why AI-Powered Dashboards Create Better Decisions
Traditional dashboards answer one question:
What happened?
Modern AI dashboards answer several:
- What happened?
- Why did it happen?
- What should happen next?
- Which metrics require immediate attention?
- What trends are emerging?
By combining real-time monitoring with artificial intelligence, organizations spend less time analyzing reports and more time executing strategy.
Why Executive Dashboards Have Become a Strategic Asset
A dashboard is no longer just another reporting tool.
For modern SaaS companies, enterprise organizations, healthcare providers, fitness franchises, financial services, and event technology platforms, dashboards have become the operational center of the business.
The best dashboards help organizations:
- Demonstrate customer ROI
- Increase software adoption
- Improve customer retention
- Identify operational risks early
- Accelerate executive decision-making
- Improve forecasting accuracy
- Create organization-wide visibility
As SaaStr emphasizes, the most valuable dashboards require minimal effort while delivering maximum business value—a philosophy that guides every dashboard HyperTrends designs.
Frequently Asked Questions
What is a 360-degree business dashboard?
A 360-degree dashboard combines information from multiple business systems into one centralized interface, allowing executives to monitor every critical KPI in real time.
How is a 360-degree dashboard different from a traditional dashboard?
Traditional dashboards often display metrics from a single application. A 360-degree dashboard integrates data across departments, providing a complete operational view of the business.
Why are real-time dashboards important?
Real-time dashboards help organizations detect problems immediately instead of waiting for scheduled reports, allowing faster responses and better business outcomes.
How does AI improve business dashboards?
AI analyzes large volumes of operational data, identifies patterns, explains performance changes, and generates actionable recommendations that help executives make faster decisions.
Can dashboards scale with growing businesses?
Yes. Modern dashboard platforms are designed to scale alongside business growth, integrating additional data sources, users, departments, and AI capabilities as organizational needs evolve.
Final Thoughts
Business leaders no longer need more data—they need better decisions.
A modern 360-degree dashboard transforms disconnected information into clear, actionable intelligence that helps organizations move faster, reduce risk, and improve performance.
By combining real-time analytics, AI-generated insights, intuitive navigation, and enterprise-grade business intelligence, HyperTrends builds dashboards that become strategic assets rather than simple reporting tools.
If your organization is ready to transform operational data into measurable business outcomes, explore how HyperTrends designs intelligent dashboards that help executives make smarter decisions with confidence.
Learn more at HyperTrends or Contact Us!