

I was recently working with a Startup that has a very promising upcoming product. In reviewing their product strategies, I realized a glaring omission in the overall strategy. I did not see any reporting metrics, KPI dashboards, charts/graphs, tiles or anything of that nature.
It really bothered me.
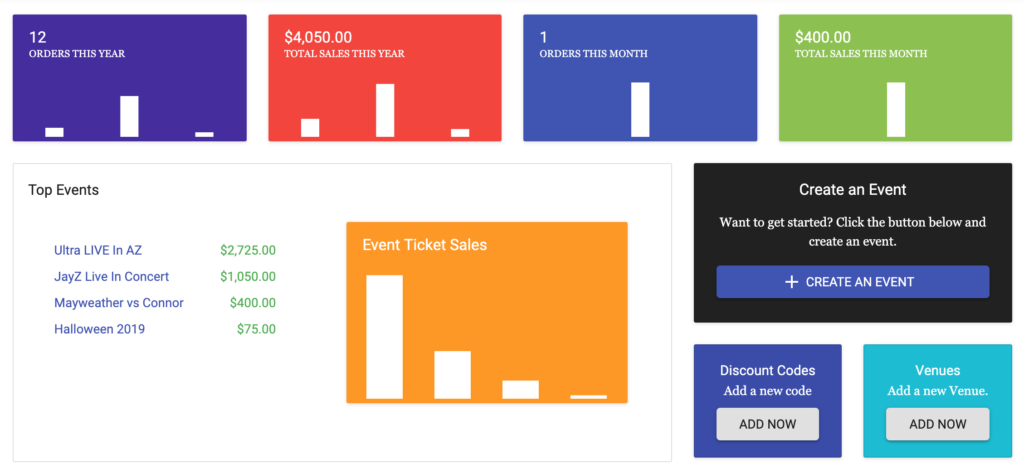
When was the last time you saw a SaaS Product without any Dashboards? Most SaaS products; whether B2B or B2C; have to provide a synopsis of the system as soon as you log in.
Metrics, KPIs or OKRs, anything of value has to be presented to you in charts and/or visual indicators. These are the key aspects of your system. These are the items that make the eye candy that decision makers look at. Rolling up data and presenting summary information is extremely important to executives on the go. A picture is worth a thousand words.
So, please do not make that mistake Startups. Build Dashboards! Build awesome looking charts or graphs. Give people the wow!